
 NOTE: No one indicator is sufficient or complete. This one can be helpful to avoid losses, lock in gains, and identify good buying opportunities. Please use with other indicators.
|
|
|
by Gaurav Singh
|
|
March 14, 2020 |
|
|
Bitcoin's Rise & Fall in 2020: Is It A Buy? |
|
|
What a brutal time for Bitcoin! It was painful watching the cryptocurrency to which all other are called Alts (alternatives) take this fall, after such a wonderful start to the year for the entire class. Last year's analysis (below) was prior to the decline, which went further than I had anticipated. That fall is also captured below in the current chart.
I had been a HODLer for quite a while and even a believer in the proposition that Bitcoin is largely uncorrelated with the financial markets (S&P 500). The latter is a proposition that, for the most part I had believed putting its historical performance under my minutely critical eye. That was an error for which I have paid over time. I chalk it up to a learning lesson and will use that it to help me going forward. Correlated or Not? I took a closer look at Bitcoin's performance, along with SPY, a proxy for the S&P 500. Using technical analysis it was humbling to note that unlike all the true believers writing all over crypto-sphere, and many experts opining on CNBC and other financial networks, Bitcoin shows a clear correlation with the markets. It may require more explanation. The correlation appears especially at the times when the market gets signals to sell and almost as regularly when the charts signal to buy the financial markets. Of course, Bitcoin's performance is outsized, it is many times that of the market. In that, one wonders whether it isn't better to buy derivates that function at several x the market, especially considering the length of the bull runs in the market. This would be the case for long-term investors. However, it is not the case for those who would like to repeatedly make significant returns (Bitcoin's returns regularly dwarfs that of the stock market). In the case one wants outsized returns on a regular basis, then Bitcoin can serve as an instrument that offers repeated opportunities both on the way up and down (shorting). So, is Bitcoin a buy at the moment? It is to the HODLers. Any major moves lower, to the Bitcoin community, are opportunities to buy. I can't tell you how many articles I have read that suggest that this moment (anytime BTC hits a low) is the all-time low and we will never get another chance like it. E-V-E-R. Except, we keep getting more chances to buy and, I see no reason why we may not get another opportunity yet again. S-O-O-N. In order to understand the reasons behind my statement, please refer to my recent analysis of the financial markets, especially in light of the COVID-19 scare and the recent crash in both the financial and crypto markets. Correlation? Obviously! The video below addresses the correlation question. |
|
|
|
|
|
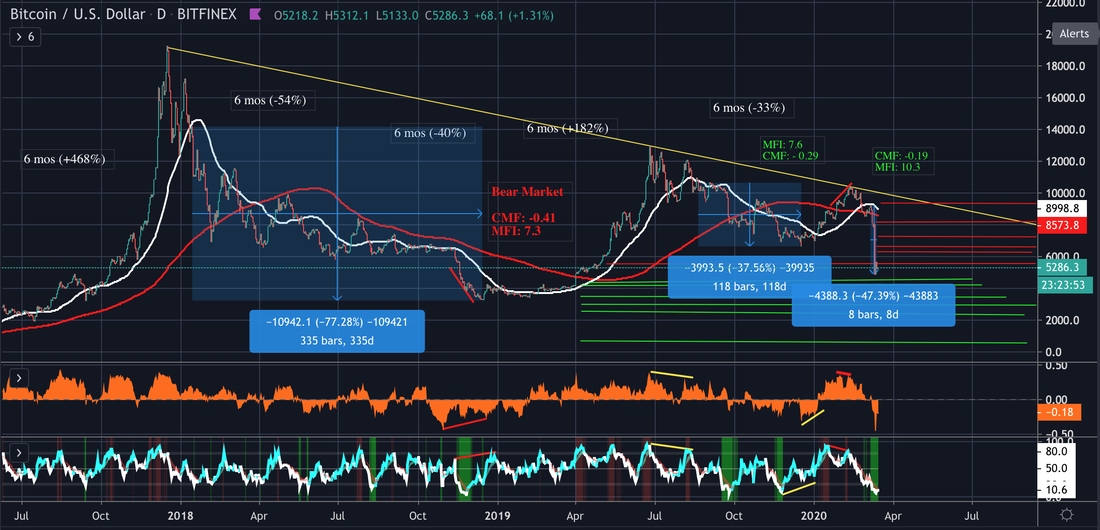
For methodology, please refer to my market analysis. Now, let's take a look at what it tells us regarding how low Bitcoin can go. First thing to note is the negative divergence in early 2020, when the money flow was decreasing and the price was increasing precipitously (the lines in red). The same divergence had happened in November, 2019, which saw a reversal after a period of consolidation. But this was going the other way around. Essentially, the writing was on the wall and sooner or later Bitcoin's price was going to hit reality and follow the money down, which it did. Only, the crypto-world always had a likely reason for why the uptrend would continue, all evidence to the contrary. My own breaking point was when the long-term uptrend and the 200-weekly SMA were broken, which has never happened before. That made clear that all bets were off. Those, like me, who held on to GBTC or various crypto (both BTC and alts) paid for it, with so many paper-gains wiped out and even incurring losses. The reasons I foresee a continued fall in Bitcoin's price are essentially the same reasons that the financial markets show plenty of room to fall. Look at the Chaikin Money Flow (CMF) and the Money Flow Index (MFI) during the last two bear markets for Bitcoin, where the CMF was between -0.29 and -0.41, while the MFI was between 7.3 and 7.6. In contrast, today, we are at a CMF of -0.19 and MFI of 10.3. There is still room to fall, just from the technical standpoint. But that is not all. Looking at the last 2 Bitcoin downturns (including the massive 2018 bear market), it is evident that our most recent crash has just begun and it will likely get deeper. Note that the 2018 bear market lasted almost a whole year, while the 2019 downturn was about 4 months. We are barely 8 days into this one! But, you may correctly point out, those aren't sufficient reasons to expect a continued descent for Bitcoin. I agree. There is a much bigger reason - namely the hysteria that is accompanying the COVID-19 is the major reason money is fleeing risky assets, and Bitcoin specifically, and crypto, generally, are extremely risky. That will continue, which will see a continued decline as we get deep into a recession, and that will impact Bitcoin, just as it is the financial markets. It is also important to note that the drop in Grayscale's Bitcoin Investment Trust (GBTC) the over-the-counter instrument used by those who either do not know how to buy Bitcoin or those who have regulatory reasons not to have custody of Bitcoin (namely, institutions) has been much worse than the instrument it is mirroring. The premium of roughly 27%-30% has disappeared. It goes to reason that institutions have pulled out a lot of the money, which is why when Bitcoin rebounded on Friday GBTC continued to fall. I have put up several levels of support below the current price, as well as resistances on the way up if I am proved wrong. It is the correlation with the financial markets that has me not be a buyer right now. I plan to start buying soon. Essentially, I plan to ladder it down before the financial markets show a reversal, at which time I plan to go all in. What do you think? What strategies are you using and why? * Disclaimer: This analysis is meant to be educational and is not financial advice. Please make your investing / trading decisions thoughtfully and in a way that is risk-adjusted, and not based in fear or greed. |
|
|
|
|
|
September 14, 2019 |
|
|
Bitcoin: Rising above the daily noise |
|
|
Bitcoin's Journey: All-time High in 2013 |
|
|
|
|
|
Bitcoin's All-time High in 2017 and the Current Bull Run |
|
|
|
|
|
|
|
|
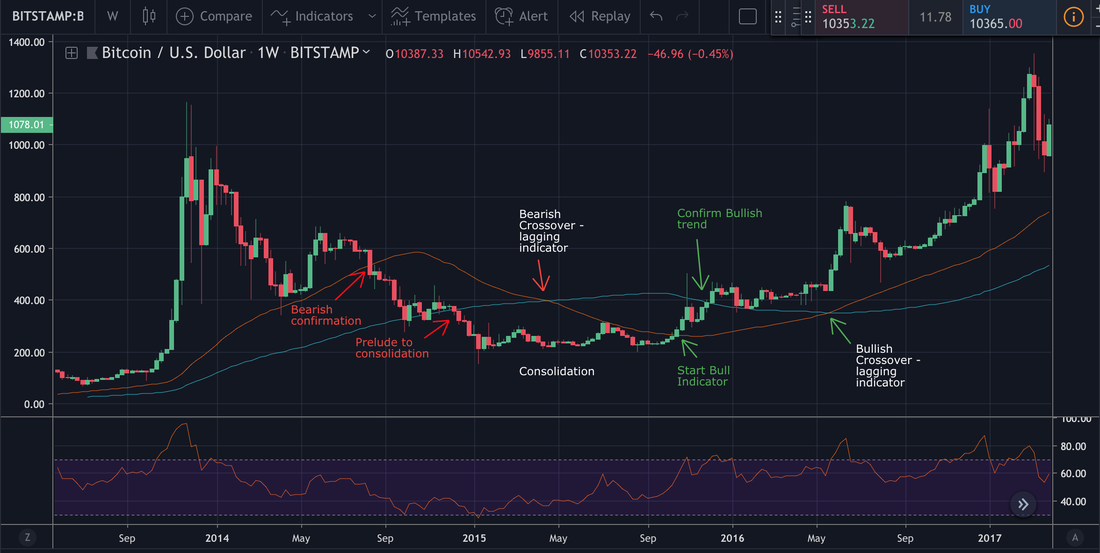
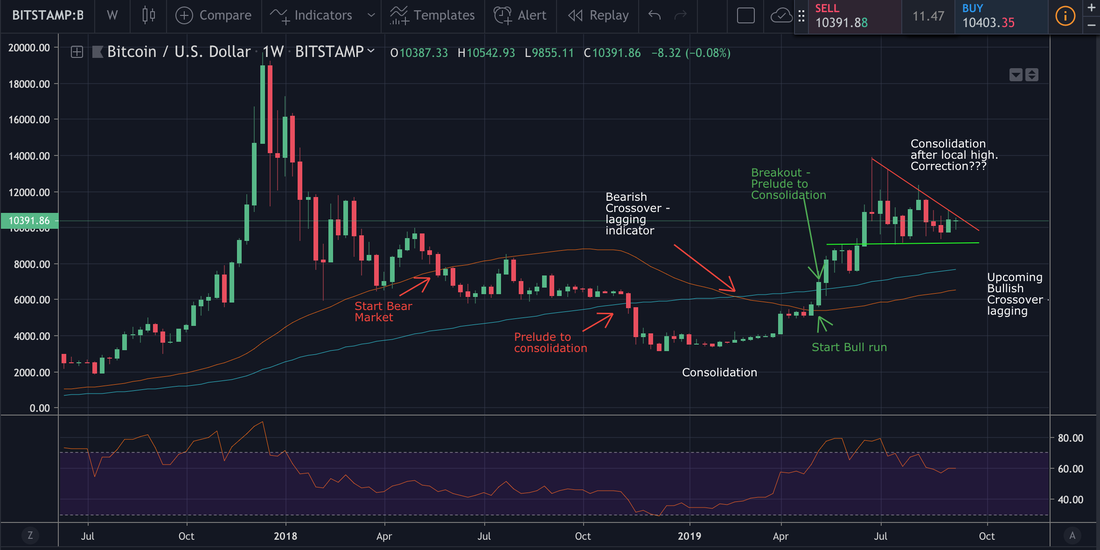
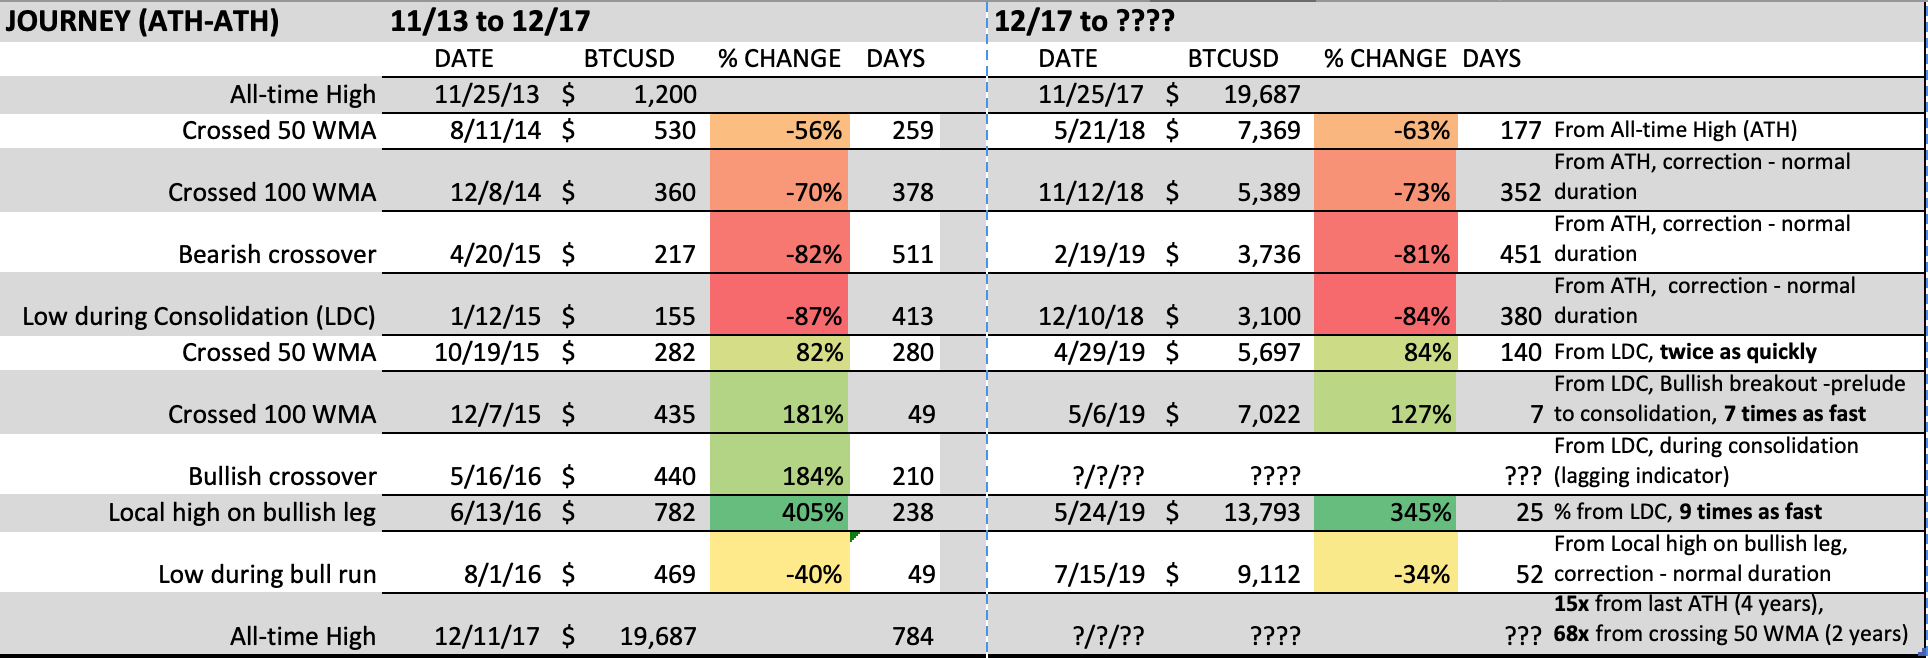
Why bother with an analysis of Bitcoin? I thought of this because there is a lot of greed, as well as gloom and doom, in the news. Numerous articles and opinions that pontificate upon the daily and short-term moves. For me, it was valuable to take a step back and look at the bigger picture and long-term trends using the 50-week and 100-week moving averages. I have compared the current performance of Bitcoin with the last multi-year run, from its all-time high (ATH) in 2013 to the next in 2017. Let's be clear, I’m not suggesting that BTC-USD will go up 15x from last ATH. The law of large numbers may cap the upside. So, then, what does this long-term view teach us? Some trends are apparent:
Why? Since, the number of players has increased substantially, it doesn’t take as long to make comparable moves up. However, declines are still comparable in both time and %. It is notable that during this rally BTC has crossed the 50 WMA, 100 WMA, and had a local high and a correction, which may not yet be complete. The bearish and bullish crossover (of the 50 WMA and 100WMA) are lagging indicators, in that they reflect what has already happened. Therefore, they are not terribly useful to anticipate what may happen, except they are psychological indicators that maybe used by speculators and technical traders as a reason to jump in. That may have been the reason behind the sudden boost to Bitcoin back in May, 2016. At the current feverish pace a lot has happened - the move from 50-week to 100-week moving average took only 7 days, while the last time it took 49. The local high (a 4x appreciation in BTC-USD price) during the last rally took 238 days after hitting the bottom. This time, Bitcoin went up 3.5x in just 25 days! This is not a prediction, as what happened last time is not guaranteed to repeat itself. It was informative and educational, though, to study the performance of Bitcoin (weekly charts) and glean some strategic approaches to investing (and not trading). View: A look at long-term trends suggest that the long-term uptrend should continue. Does that mean that the correction during the local high is complete? No, it does not. However, considering the declines/corrections have largely been comparable, even if BTC-USD were to decline again it may not be substantial (barring some big news event). Downside should be limited to between $9,100 and $8,000, if there is a breakdown from the consolidation after the recent local high. The upside is substantial, as long as one takes a long-term view. - Gaurav Singh * Disclaimer: This analysis is meant to be educational and is not financial advice. Please make your investing / trading decisions thoughtfully and in a way that is risk-adjusted, and not based in fear or greed. |
|
|
|
