|
|
Stock Market Analysis |
by Gaurav Singh
April 17, 2020 |
Hola! I'm back to share my take on the market outlook and hope you find it interesting.
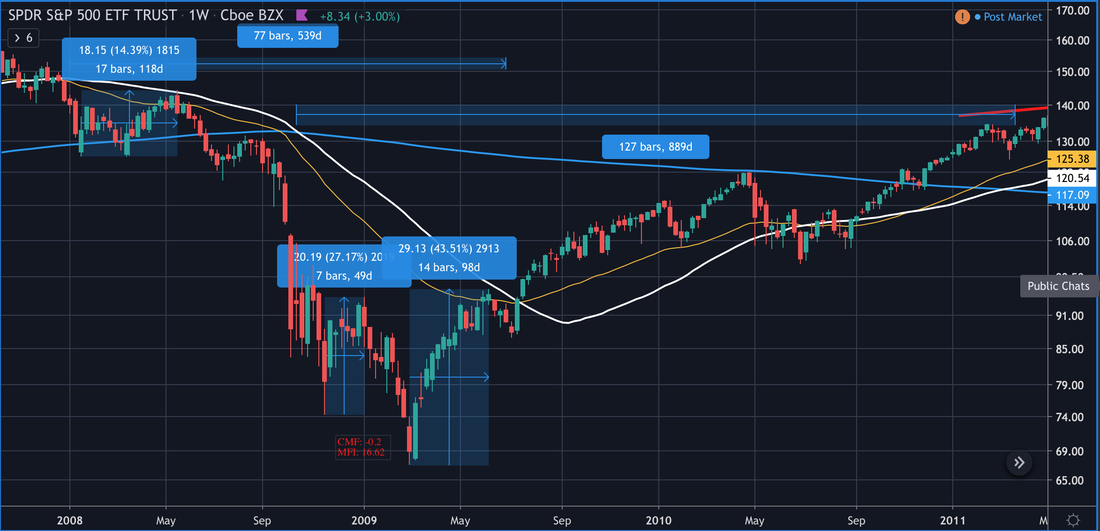
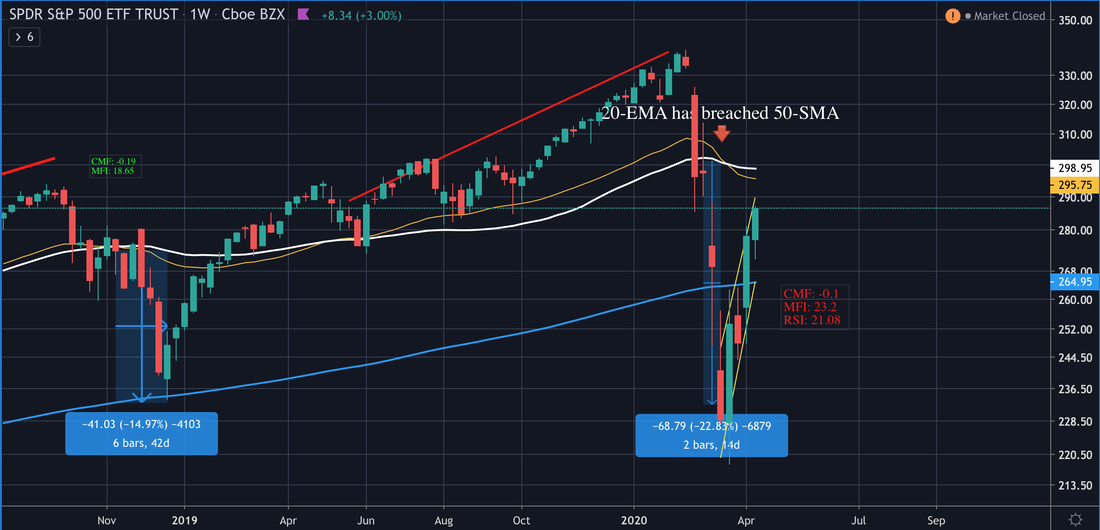
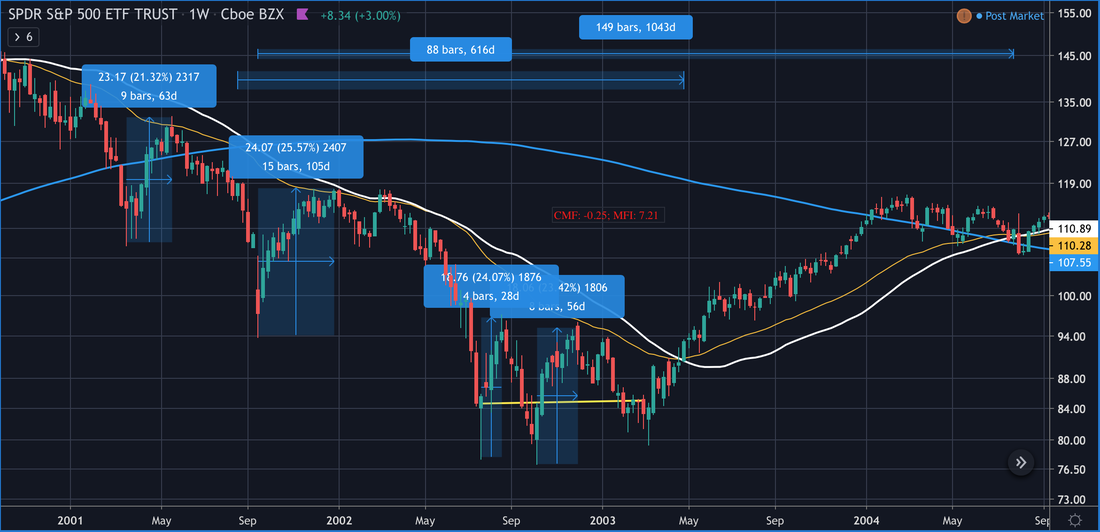
It was reported today that the Chinese economy shrunk by almost 7% in the first quarter of this year. The consequences for the US economy may be no better, relatively speaking, and much worse. Am I being an alarmist, when the stock markets have bounced back so promisingly? Allow me to illustrate my reasoning by way of the last two bear markets. It is legitimate to question whether it's fair for one to to compare this recent downturn to past bear markets? Yes, it is, because this time the consequences maybe more severe (as I have mentioned below) considering that the US economy (most non-essential businesses) are shut down and will be significantly affected over the next 18 months, and more than 2/3rd of our GDP is driven by consumer-spending, which will be severely curtailed for some time. Bear Market #1: The Tech Bubble The weekly chart shows some interesting things: Bear Market #1 started when the price of the S&P 500 was rejected at the 50-SMA and headed lower. The bearish trend continued as the 20-EMA (Exponential Moving Average) stayed below the 50-SMA (Simple Moving Average), as would be expected during a bear market. The trend started on Nov. 6, 2000 and hit a bottom after 693 days in 2002, having dropped -46%. My first piece of evidence for not getting too excited about this current market rally (dead cat bounce) is that during those 693 days of the Bear Market #1, before bottoming out, the S&P 500 had four rallies that returned more than 20% and ranged from between 28 days to 105 days. At this time, the current rally is almost to the 50-SMA and has recovered over 30% of the initial losses. That, however, is not terribly shocking considering the massive and sharp drop that preceded this recovery and, in hindsight, was anticipated. I didn't anticipate the suddenness of both moves, just the trend. Now, it would be useful to look at Bear Market #2, the Great Recession: This time, the S&P 500 found it's relative bottom after dropping -55% over 434 days. On its way to the bottom, the market rallied three times recovering +14% to +44% in rallies that lasted between 49 and 118 days. Bear Market #2: The Great Recession |
|
|
March 14, 2020 |
|
|
Welcome back!
Thank you to those who reached out having found value in the analysis. Below is a slightly edited and updated weekly chart (for this week) highlighting what I surmised earlier:
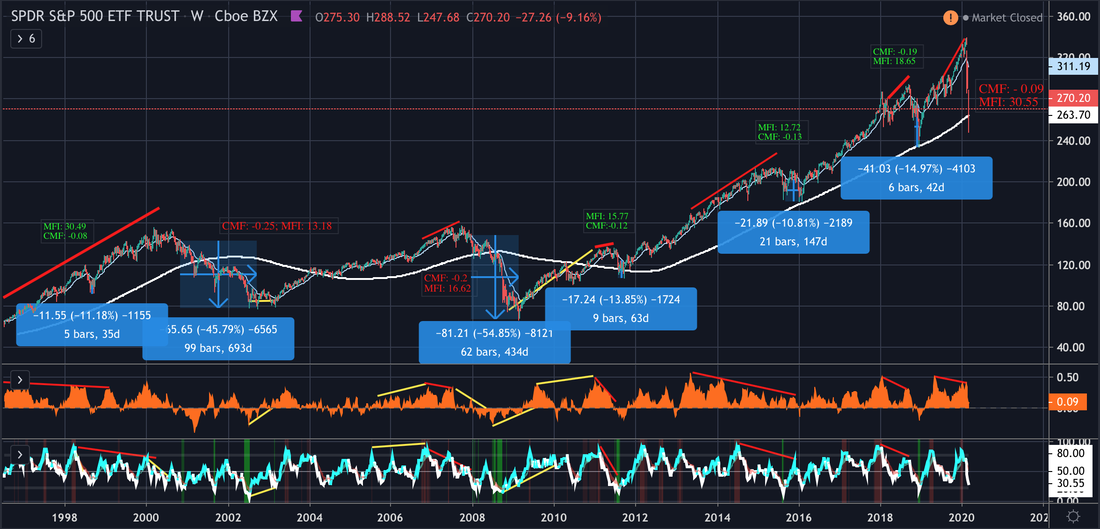
Please note that the Chaikin Money Flow (CMF) has, finally, turned negative and the MFI (Money Flow Index) is still over 30. Compared to previous bear markets, this is still high and there is room to go much lower. For those people who are in a buy-the-dip mentality of old, it may not be a good idea! Why not? Because context matters. In a normal market and especially during a long bull-run, buy-the-dip was a good strategy for many traders and investors alike. The S&P 500 (SPY) breached the 200 SMA but closed above it, owing to the massive rebound on Friday. That rebound was likely the result of the Trump administration calling the COVID-19 an emergency and the old mentality of buy-the-dip reflex and a buy signal for both the CMF (bullish divergence) and MFI indicators on the daily charts. I do not expect this (confusingly bullish) respite to last and am covering the risk by buying VIX short-term futures, that have already spiked 500% since Feb 21. These should be used with care and are not buy-and-hold type of instruments. If you need proof, then please look at a daily chart going back years for any of the VIX instruments (and, I am not even talking about the leveraged ones, which can spike and crash many multiples of the VIX). |
|
|
Am I suggesting that this Friday's recovery will not last?
This latest optimism was based on a technical signal on a daily chart and, possibly the declaration of COVID-19 as an emergency, which is a declaration ~2 months late. Just like the illogical bullish divergence I pointed to in my original analysis below (that technical analysis indicated that the market should have been sold as early as Dec '19 / Jan '20), this declaration of an emergency by the Trump administration is backwards looking and much too late. A lot of their optimistic posturing are weak attempts at controlling a rising panic at the government's lack of preparation. Trump's mention of a miraculous cure relects this lack of preparation, which is being felt by millions of Americans. People are already hoarding, which is evident via the massive lines at supermarkets and at your local Costco / Sam's Clubs. Am I being pessimistic? I think not. My childrens' schools are closed next week, which will be followed by Spring Break. It is very likely that we may see distance-learning measures go into effect following that. Already businesses are asking employees, who still have jobs, to work from home. Many contractors (an alarmingly high proportion of the US workers) have already lost their jobs (read contracts, no PTO or benefits). Based on these facts, it is obvious to surmise that we will have a lot of people sitting at home, many of them without incomes. These millions will not be shopping or eating out or traveling for vacations. That will have significant negative consequences for employees in these industries (which will only compound the effects already being felt). Thus begins a vicious (destructive) cycle and a feedback loop that could have been alleviated by a competent government response. The woefully inadequate response and fake optimism by the current administration will become further evident in the financial markets, because we are an economy largely driven by consumer-spending (which makes up 70% of GDP). A likely solution is for the federal government to give money directly to those with the least. They should do so because the poor / "middle class" are the ones who will spend it on necessities. Spending has a large multiplier effect upon the economy and growth of businesses (which is reflected by an increase in the price of their company's shares). The Trump administration does not get this, which is why they were planning to cut food stamps (on April 1st) until a judge just blocked them from doing so. On the other hand any tax cuts for the wealthy are ineffective because they invest it, rather than spend it. At this point, no honest and informed person would contest this assertion, as there is overwhelming proof of this fact (every dollar increase to SNAP benefits - food stamps - generate $1.70 in economic benefits and is not contributing to the nation's long-term fiscal problems). So, jobs are being lost, panicked people are going to have to stay home from work, businesses are going to be hit big and we still don't know how many Americans are infected! As soon as those projections are released, and if we are anything like the rest of the world, it is not going to be encouraging. Angela Merkel estimated that 60%-70% of Germans are projected to be infected and for this crisis to be more extraordinary than the banking crisis of the last decade. If we estimate ~ 50% of Americans, then that number is ~ 165 million people. Even a mortality rate (current estimate by the WHO) orders of magnitude smaller than the WHO's current estimate is shockingly high (you can do the math). We have an unfolding global tragedy of which we are about to feel the full brunt. The effects will be reflected in the financial markets. Far more important at this time: my family and I are planning to help at a local homeless shelter. Please think of those who don't have any help. If you are reading this, then you are likely someone of means with investments. There are a lot of people who didn't have much before this tragedy, and will desperately need our help. Our thoughts and prayers are not going to feed them or help them in any meaningful way. So, please do your part, while taking all due precautions. Love to all! Gaurav Singh * Disclaimer: This analysis is meant to be educational and is not financial advice. Please make your investing / trading decisions thoughtfully and in a way that is risk-adjusted, and not based in fear or greed. |
|
|
|
|
March 9, 2020
|
|
|
The markets have been heading significantly lower for the last couple of weeks. Each time this happens it tends to be unnerving for many. On the other hand, I have been expecting this downturn for some time and am sharing what I see when taking a longer view that removes some of the noise.
Please share if you find the analysis useful. |
|
|
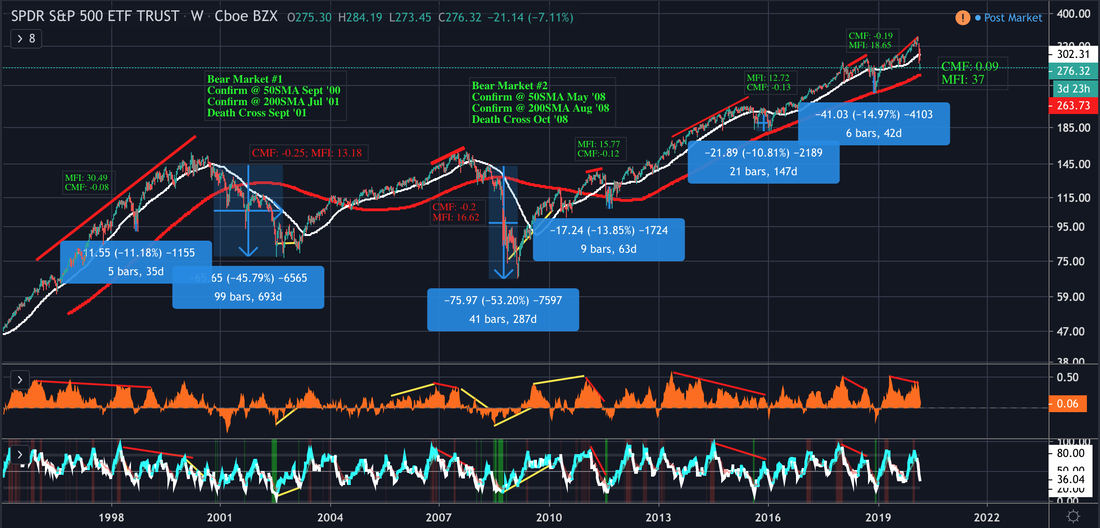
Summary Taking a look at the Standard & Poor 500's performance over the last 20 years it is evident that many talking heads on TV were grossly premature in their call to buy stocks after the recent fall, wrongly suggesting that stocks are now cheaper (discounted). This advice was given by both experts, as well as opportunistic politicians (Pres. Trump) concerned with their own re-election than with the pain of a scared population. While the stocks are certainly priced cheaper now, there is a difference in buying something that is a good value and trying to greedily catch a falling knife. The latter can be quite painful! As the weekly chart highlights, speaking as of this morning (@ 11 am CDT on Monday, Mar 9, 2020) we have not yet hit the 200 simple moving average (SMA). Considering that this most recent bull market is now in its 12th year this correction was long overdue. It is likely that a recession is coming, and that we may already be in one (video below). Is it time to buy? Not according to the charts. It seems unlikely that we are even close to the bottom. We may yet have a ways to go. The first major hint is timeframe. Of all the market downturns in the last 20-plus years, the shortest one was over one-month long and we have only just begun our 3rd week. But, first, let me take a moment to explain my methodology. Methodology: In looking at recent downturns, both corrections, and bear markets, I chose to remove distractions (of shorter timeframes, such as daily and hourly). Timeframe: This is a weekly chart. Shorter timeframes are appropriate for trading. This high-level view is from a viewpoint of investing. How come the corrections to the stock market and bear markets are marked as being over so quickly? It is important to note that when looking at the length of corrections and bear markets, I am looking only at the timeframes after the market is rejected at the 50 SMA and until it hits the bottom (before recovery) which is confirmed by a couple of indicators (at the bottom of the chart). I am not measuring the timeframe to when the price rises back above the 50 SMA or when the 50 SMA goes above the 200 SMA (golden cross) and confirms a long-term bullish trend. Why not? I don't think that you or I care how long that takes to happen. My suspicion is that you are concerned with what is the best, or close to the best, time to enter back into the market with the cash that should currently be on the sidelines. Moving Averages: Even on a weekly timeframe, the market routinely breaks below the 50 SMA and recovers. Hence, in order to measure corrections and bear markets, I look at the times when the price attempts to cross back over the 50 SMA, is firmly rejected and consequently heads lower, thus confirming the downtrend. Why? It is because it is just as likely that the market may have recovered, as it does on other occasions. In that case, it would not be a correction and just become the noise that I am ignoring. The rejection confirms that a downtrend is the likely future. After being rejected at the 50 SMA, the market could yet recover by bouncing off the 200 SMA. Most of the time it does just that and we call these corrections or normal adjustments for a market that was overbought or expensive. But when even the 200 SMA cannot give support and the market breaks below the 200 SMA, then we slide into a bear market. That is confirmed when the 50 SMA crosses below the 200 SMA (ominously referred to as the death cross). The 4 corrections in the last 20+ years lasted months. On the other hand, the 2 bear markets persisted for years. The first major thing to notice about the current downturn is that we are barely into the third week of this downtrend. However, the steepness of the decline is unusual. It is likely the result of the length of this irrationally exhuberant bull market. This irrationality is further evidenced by President Trump's tying his own success and failure with the stock market (he expected it to continue indefinitely). The market's recovery preceded the 2016 election (it was arguably underway since 2009), was years into a bull run and this hot market was further boosted by the recent tax cut which benefited the wealthy investor class most. But, all good (easy) things must come to an end. And, after roughly 11 years, the end (to this bull market) is nigh! Money Flow Taking a look at the flow of money it is again clear that the bottom of each correction, at a weekly timeframe, was a negative value. During the bear market and when the market was about to turn a corner that number was much lower. Currently, the flow of money is still positive. That suggests that the drop is going to be deeper. When the fear is rampant and enough money has gone out of the market, reflected by a negative value in the money flow, I expect we will see a reversal and a new bull run. Until then, it is a correction --> bear market (recession). Is this a case of hindsight bias? Far from it. These indicators had predicted the downturn well in advance. Please make note of the red lines on the indicators. These highlight when the price of the market is diverging from the direction of the money that is entering/exiting the market. So, when the money is, on balance, moving out of the market and the price is going higher that is a problem. Sometime later, the price catches up with reality and the market heads lower. Thereofe, it was evident that there was a problem in the market since last year, and by now it was high time for the price to match the money flow. It has now done so! In that sense it is healthy for the market. Speaking of health...is this market "crash" because of the COVID-19 or this morning's news regarding Russia and Saudi Arabia and the supply of oil? Noise, noise and more noise... all these are merely reasons. We need to look to the fundamental cause. It is highly likely that this downturn, whether it is a correction or the start of a bear market, is due to an overbought and overextended market. If it wasn't COVID-19 or the oil supply, then we would be discussing another reason. But reasons are post-fact and backwards-looking. In fact, it is almost undeniable that we are already in a bear market considering a majority of the Russell 3000 are down over 20% (the most common measure of a bear market). Perhaps the only real question is the scale of the upcoming recession. Either way, the charts showed us in advance what was about to happen. Those who paid heed to the lessons did not suffer the full extent of this downturn. Others may even have profited handsomely. If there is a deeper malaise that needs correction, then we may be in a severe bear market and just don't know it yet (video below). That may last for years. There is a case that this is a storm that was brewing since the recent, and highly irresponsible, Trump tax cuts for the wealthy. The situation is akin to the recession that hit during George W. Bush's term, and after those irresponsible tax cuts for the wealthy. Any risks / impact from the trade slowdown due to COVID-19, housing, student loans or mortgage delinquency from resultant unemployment, when businesses lay off workers (mostly contractors), may result in a snowball effect taking us deeper into a recession (bear market) that may last years. But not all is lost. Remember that the chance to buy at the bottom comes up much quicker than does the indicator that we are out of a bear market. * Disclaimer: This analysis is meant to be educational and is not financial advice. Please make your investing / trading decisions thoughtfully and in a way that is risk-adjusted, and not based in fear or greed. |
|
|
|
|
|
Read this piece to learn more about Prof. Harvey's Inverted Yield Curve, a powerful indicator that predicts recessions. If you feel up to it, then read his dissertation from 1986. |

